
Phase transitions are driven by the minimisation of the free enthalpy of the system: If at a certain temperature the entropy contribution of the Gibbs enthalpy outweighs the enthalpy contribution in $$\Delta G=\Delta H-T\Delta S\qquad,$$ the high-temperature phase will become the thermodynamically stable one. The precise nature of this change, i.e. how smoothly or abruptly it occurs, is different for different types of phase transition. To describe this, phase transitions are classified into first-order and second-order transitions. The order referred to here is the order of the differential of the Gibbs enthalpy for which a step is observed at the phase transition.
Unfortunately, the term order is used for two different concepts in relationship to phase transitions. On the one hand, each phase transition involves an ordered (low-temperature) and a disordered (high-temperature) phase - on the other hand, the order of the transition (in the mathematical sense of the word) determines the severity of the changes as described above.
| 1st order | 2nd order | |
|---|---|---|
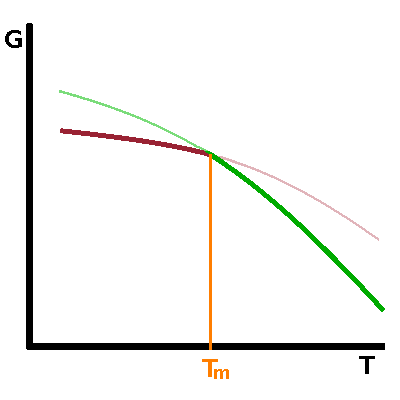 |
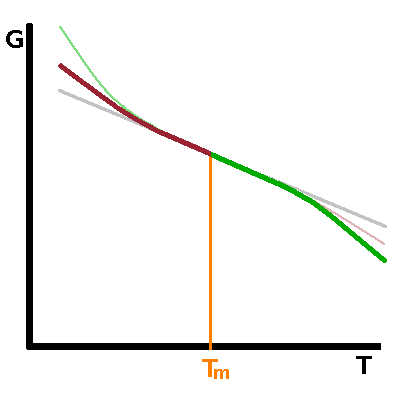
The free enthalpy, $G$, of both phases involved in the transition is a smooth function of temperature. At the transition point, the curves of both phases intersect - on crossing the transition point, the other phase becomes the thermodynamically stable one. As a result, there is a kink in the free enthalpy of the system (under equilibrium conditions) at the transition point of a first-order transition. In a second-order transition, the free enthalpies of both phases are identical over a limited temperature range before diverging either side of the transition. Both curves have the same tangent at the transition point. |
 |
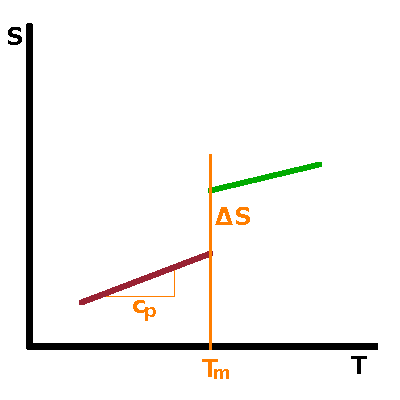 |
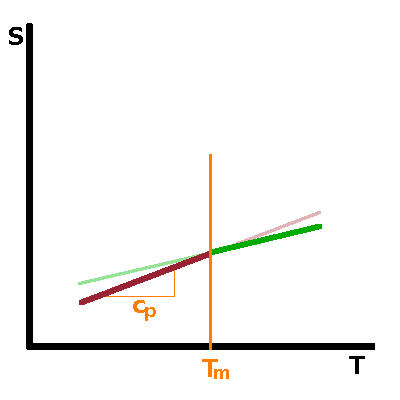
From the discontinuous or continuous behaviour of the free enthalpy, respectively, follows the shape of the 1st derivatives of $G$, such as entropy, $S=\left.\frac{\partial G}{\partial T}\right|_p$, or volume, $V=\left.\frac{\partial G}{\partial p}\right|_T$, or any of the other first derivatives originating from the Maxwell relations. For first-order transitions, the kink in $G$ corresponds to a step in its first derivatives at the transition point. This is a result of the latent heat associated with the transition. In the case of second-order transitions, there is no latent heat and therefore no step in the entropy at the transition. However, the slope of the curve changes abruptly, producing a kink similar to that in $G$ itself for first-order transitions. |
 |
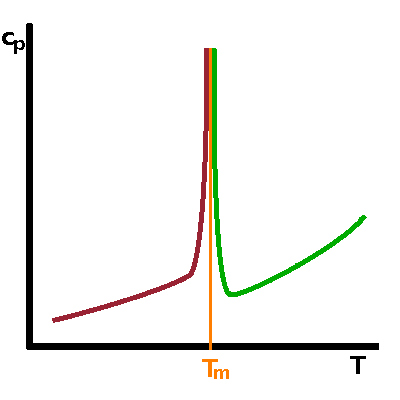 |
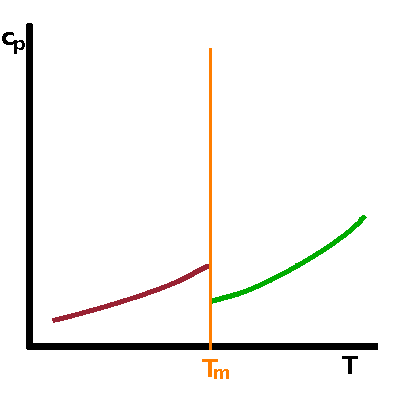
Neither free enthalpy nor entropy are easy to measure, but the 2nd derivatives of $G$, such as the heat capacity, $c_p=T\left.\frac{\partial S}{\partial T}\right|_p=-\left.\frac{\partial^2G}{\partial T^2}\right|_p$, tend to be good observables. A step in a function causes its derivative to have a singularity: For a first-order transition, the heat capacity therefore goes to infinity when the transition point is approached from either side. For a second-order transition, the kink in $S$ merely results in a step in its derivative. |
 |
|
|
The diagrams above show the free enthalpy and its derivatives as a function of temperature, assuming that the phase transition is triggered by a change in temperature. The kinks, steps and singularities are observed whatever state variable is being varied, although the direction and steepness of the slopes of the various functions may be different. For example, we know that the high-temperature phase usually corresponds to the low-pressure phase at a phase boundary; therefore, the slope of $G$ must be positive if plotted against pressure. However, there will still be the familiar crossover of the free enthalpy curves for both phases at the transition point.
Mathematically, the distinction between first and second-order phase transitions is very clear: either there is a latent heat at the transition or there isn't; either the heat capacity becomes infinite at the transition or it doesn't.
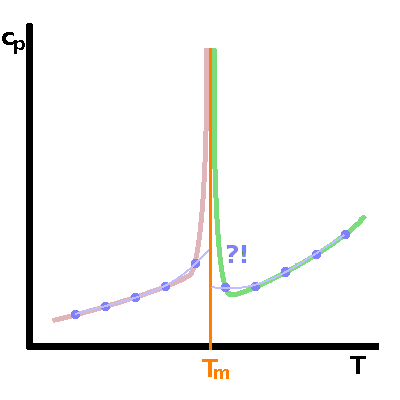
However, in practical terms the distinction is less clear. Heat capacities (or other quantities) cannot be measured continuously because we cannot vary the temperature (or other state variables) with infinite precision, and also because the system needs to be kept in thermodynamic equilibrium throughout the experiment, which would require an infinitely slow (quasi-static) experiment. If all experimental date we have are the blue dots shown in the diagram, we wouldn't be able to distinguish a first-order from a second-order transition at that level of precision.
To complicate matters, an increase of the heat capacity to effectively infinity is sometimes observed in crystallographic phase transitions but the rise begins gradually significantly below the transition temperature. This is at odds with the mathematical definition of a singularity as a single point at which a function has no finite value. Such phase transitions are referred to as lambda transitions because the shape of the heat capacity curve resembles the letter λ.
Landau theory enables us to describe and track the changes of a system as it approaches a phase transition in a generalised fashion, irrespective of what kind of transition (states of matter, magnetic, crystallographic...) it is.