
Given that the number of atoms in the specimen doesn't change during a tensile test, the strain measured on the specimen as a whole is the same as that measured by determining the lattice spacing along the tensile axis: $$\epsilon=\frac{\Delta L}{L}=\frac{\Delta d}{d}\qquad.$$ The assumption made here is that the strain is homogeneous strain, i.e. it affects all lattice planes perpendicular to the tensile axis to the same extent. A compressive strain will therefore reduce $d$ in Braggs' law by $\Delta d$. As a result, the diffraction peak will shift to the right, i.e. the scattering angle will be increased by $\Delta\theta$: $$n\lambda=2(d-\Delta d)\sin{(\theta+\Delta\theta)}\qquad.$$ For a tensile strain, $d$ is increased and $\theta$ decreased accordingly. Both vary in opposite directions because the two quantities are a Fourier pair.
While homogeneous strain leads to a peak shift, inhomogeneous strain, i.e. strain affecting different parts of the specimen to a different extent, will lead to strain broadening because effectively Bragg peaks of regions of the sample with different lattice spacing are superimposed.
On the (not always justified) assumption that inhomogeneous strain is the only factor affecting the Bragg peak width, we can replace the peak shift $\Delta\theta$ with the full width at half magnitude, $\beta$, and express the change of the lattice parameter in terms of strain, $\epsilon=\frac{\Delta d}{d}$: $$n\lambda=2(d-\epsilon d)\sin{(\theta+\beta)}\qquad.$$ Using the trigonometric relationship $$\sin{(x\pm y)}=\sin{x}\cos{y}\pm\cos{x}\sin{y}$$ we have $$n\lambda=2(d-\epsilon d)(\sin{\theta}\color{red}{\cancel{\color{black}{\cos{\beta}}}^1}\pm\cos{\theta}\color{purple}{\cancel{\color{black}{\sin{\beta}}}^{\beta}})\qquad,$$ where we can approximate $\cos{\beta}\approx 1$ and $\sin{\beta}\approx\beta$ as long as $\beta$ is no more than a degree or so wide. This leaves $$n\lambda=(2d-2\epsilon d)(\sin\theta+\beta\cos\theta)\qquad.$$ By expanding the product, $$\color{red}{\cancel{\color{black}{n\lambda}}}=\color{red}{\cancel{\color{black}{2d\sin\theta}}}-2\epsilon d\sin\theta+2\beta d\cos\theta-2\beta\epsilon d\cos\theta\qquad,$$ we can see that the left hand side and the first term on the right are the original (unstrained) Braggs' law, which we can therefore subtract, leaving: $$0=-2\epsilon\color{red}{\cancel{\color{black}{d}}}\sin\theta+2\beta\color{red}{\cancel{\color{black}{d}}}\cos\theta-2\beta\epsilon\color{red}{\cancel{\color{black}{d}}}\cos\theta\qquad.$$ Since $d$ appears in all surviving terms, we can cancel it away. Dividing by $\cos\theta$ produces $$0=-2\epsilon\tan\theta+2\beta-\color{red}{\cancel{\color{black}{2\beta\epsilon}}}$$ since $\tan{x}=\frac{\sin{x}}{\cos{x}}$. The last term can be neglected compared to the others since it contains the product of two small quantities, the strain and the peak width. This we can solve for $\beta$ to derive a formula for the peak broadening due to the presence of inhomogeneous strain in the sample: $$\beta=4\epsilon\tan{\theta}$$ on the assumption that there are no other factors contributing to the peak width.
S Rios, EKH Salje, SAT Redfern
Nanoquartz vs. macroquartz: a study of the α-β phase transition
Eur Phys J 20 (2001) 75
The case study presented in this box demonstrates how strain can be determined quantitatively from x-ray diffraction line broadening. The authors set out to investigate how strain relates to the phase transition between $\alpha$-quartz and $\beta$-quartz, two quite similar crystalline forms of $\mathrm{SiO_2}$ which are thermodynamically stable below and above a transition temperature of $\mathrm{573^oC}$, respectively. They also wanted to find out if the particle size, if it becomes very small, has any bearing on this. This adds a complication, since we should expect line broadening to be influenced both by particle size and by strain. It will therefore be necessary to separate the two contributions.
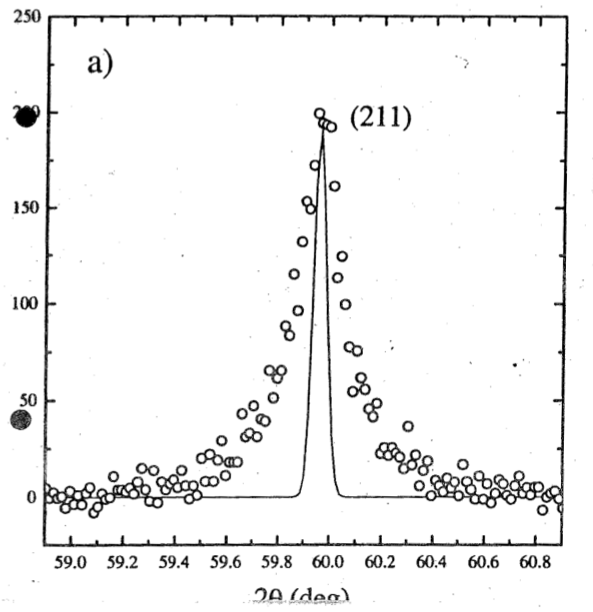
The authors of the case study present XRD data taken with a modified diffractometer equipped with a monochromator, i.e. a single crystal which selects one particular wavelength if x-rays are taken off it at a fixed angle. This reduces the width of the spectrum coming from the source and, in particular, removes the $K_{\alpha\,2}$ line which normally would produce a shoulder on the right flank of any diffraction peak. This comes at a price, as the intensity of the beam is significantly reduced. However, it means that the instrument function, i.e. the peak broadening caused by the divergence and the spectral variation of the source is much narrower than on a normal lab diffractometer. The intrument function is shown in the Fig. as a line superimposed on the measured data of one Bragg peak. As we have seen before, the measured linewidth can be corrected for instrument broadening: $$\beta=\sqrt{\beta_{\mathrm{sample}}^2-\beta_{\mathrm{reference}}^2}\qquad,$$ assuming that both functions are Gaussians.
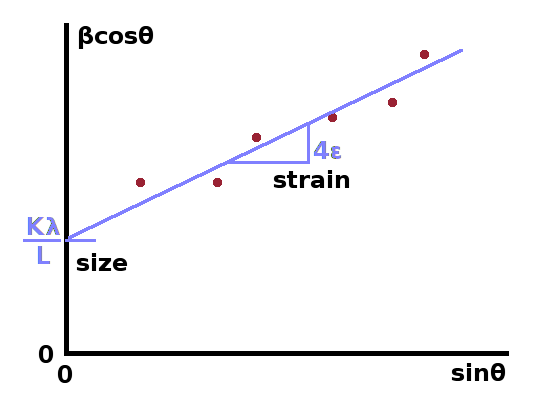
The Williamson-Hall method allows separation of size and strain broadening by exploiting their different dependence on the scattering angle. After the intrument function has been removed from the full width at half magnitude of all Bragg peaks, the corrected fwhm will consist of a size component and a strain component, whose angle dependence we know from the Scherrer equation and the derivation of strain broadening above: $$\beta=\beta_{\textrm{size}}+\beta_{\textrm{strain}}\\=\frac{k\lambda}{L\cos{\theta}}+4\epsilon\tan{\theta}\qquad.$$ By multiplying this with $\cos\theta$, we get a linear equation: $$\beta\cos{\theta}=\frac{k\lambda}{L}+4\epsilon\sin{\theta}$$ whose intercept is $\frac{k\lambda}{L}$ and whose slope is $4\epsilon$ if $\beta\cos\theta$ is plotted against $\sin\theta$.
In principle, it should be possible to fit a straight line through the data points corresponding to all the Bragg peaks contained in a diffractogram. However, it should be noted that the column length, $L$, is the particle size along a particular lattice direction, and strain may also be different along different crystallographic orientations. Therefore, including all Bragg peaks of a sample in a Williamson-Hall plot may lead to systematic errors. Strictly speaking, only homologous peaks (sequences such as {120}, {240}, {360}...) should be used. However, this would mean that a straight line would be fitted through very few data points, which is also error prone. In most cases, therefore, all peaks are included and the data sets inspected for systematic deviations from the straight line fit.
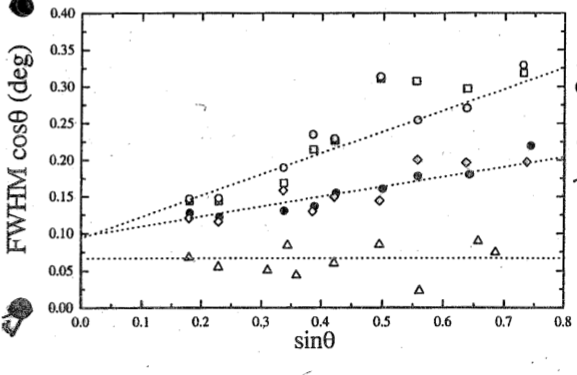
In the case study, diffractograms were taken at various temperatures both while heating the sample across the phase transition temperature and during cooling it below the transition. The experimental Williamson-Hall plot shows the straight-line fits taken from diffractograms far below, approaching and just below the phase transition. The slopes are getting progressively steeper, indicating that the samples become more strained as the phase transition is approached. The open and full symbols show data taken on heating and cooling, respectively. Since they co-incide, it can be concluded that the strain measured isn't simply caused by thermal expansion causing grains to impinge on each other as this would only occur on heating. The intercept of the curves doesn't change significantly, indicating that there is no change to the particle size during the experiment.
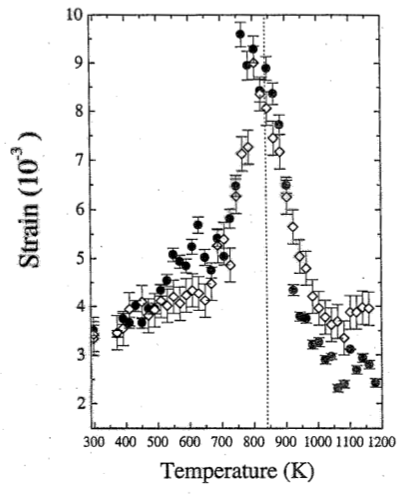
Since the case study is concerned with the significance of strain to the phase transition between $\alpha$-quartz and $\beta$-quartz, the authors show the strain determined using the Williamson-Hall method as a function of temperature. Again, open and full symbols distinguish data taken during heating and cooling, respectively. As can be seen, there is a gradual increase in strain as the phase transition is approached from either side which becomes progressively steeper very close to the transition. The rate of change with temperature is steeper above the transition than below. This is a behaviour which is commonly observed in phase transitions. This lambda-shaped dependence of the strain on the temperature is typical of an order parameter, i.e. a quantitative measure describing the approach of a system to a phase transition as predicted by Landau theory.
In the last few sections, we have explored how defects of the crystal structure can affect the properties of a material, and how such defects and their effects can be measured quantitatively. However, a solid can be highly ordered and defect-free without having translational periodicity: quasicrystals.