
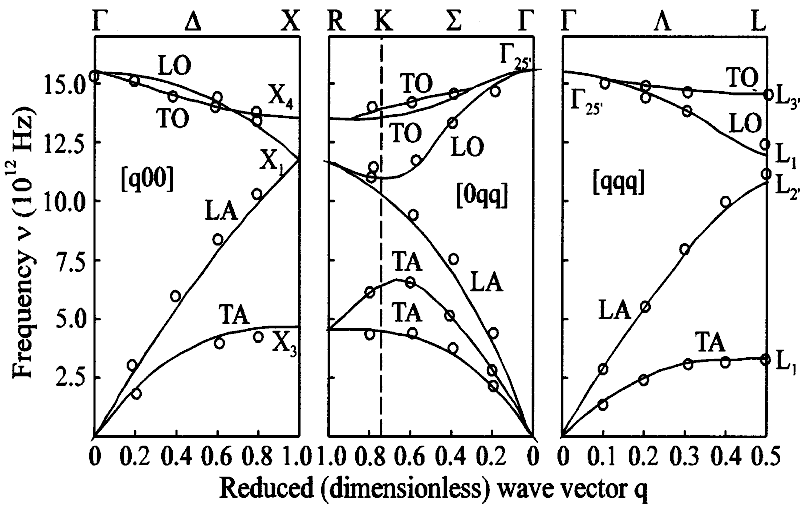
We have been able to derive the dispersion relations for very simple systems such as the diatomic chain. However, the equations become quite complicated even for such simple models. Therefore, we may expect that experimentally obtained dispersion relations of real crystals will have much more intricate features. The Fig. shows an experimental dispersion relation for diamond. The three panels show the various dispersion branches in three independent crystal orientations. For each direction, there are acoustic and optical branches, and both split into longitudinal and transversal modes (longitudinal acoustic (LA) and optical (LO) and transversal acoustic (TA) and optical (TO)). In some cases, the transversal branches split further because the crystal structure is different in the two directions normal to the direction of wave propagation, causing the transversal dispersion to be different depending on the orientation of the transversal displacement of the lattice planes.
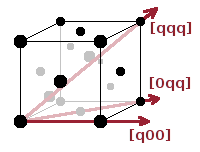
For any crystal structure, we need to choose three independent directions along which we measure the phonon dispersion. An arbitrary wave travelling through the crystal can then be described as a linear combination of waves travelling along these three chosen directions. If the symmetry of the crystal is such that the three lattice parameters are different, the three lattice vectors, $\vec{a}$, $\vec{b}$ and $\vec{c}$ can be used for this purpose. However, if the structure has identical lattice parameters in different directions (e.g. $a=b=c$ in a cubic crystal), the dispersion would be identical in all of these directions. Therefore, the three chosen directions are one of the lattice vectors, one of the face diagonals and one of the spatial diagonals of the unit cell.
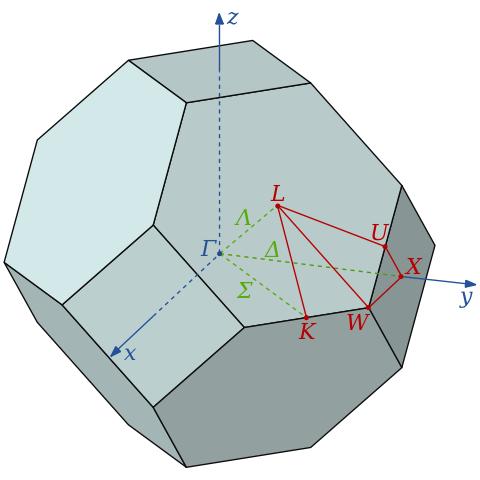
The positions along these axes are indicated by capital Greek and Latin letters along the top of the experimental dispersion relation figure. The origin of the Brillouin zone is indicated by $\mathrm{\Gamma}$, and the boundaries of the first Brillouin zone are shown as X, K and L in the three principal directions $\mathrm{\Delta}$ (lattice vector), $\mathrm{\Sigma}$ (face diagonal) and $\mathrm{\Lambda}$ (space diagonal), respectively.
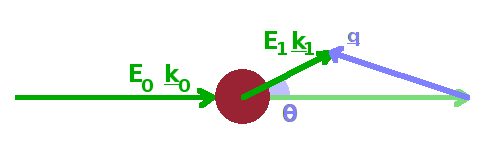
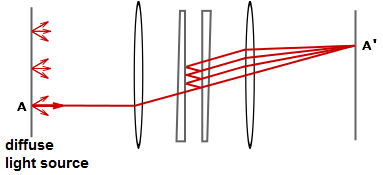
There are a number of different experimental techniques which allow to determine dispersion relations experimentally. Each focuses on a different part of the vibration spectrum. They have in common that they are inelastic scattering techniques, i.e. techniques where both the frequency (energy) and the wave number (momentum) of the probing beam are changed during the interaction with the phonons in the sample. The interaction of the incident wave with the sample is subject to momentum conservation, $\hbar\vec{q}=\hbar(\vec{k}_1-\vec{k}_0)$, as well as energy conservation, $\hbar\omega=E_1-E_0$. The magnitude and direction of the scattering vector $\vec{q}$ reveals the amount of energy and momentum transferred from the beam to the sample or vice versa. Therefore, the measurement of the dispersion relation comes down to relating the dependence of the energy of scattered wave-particles (photons, neutrons) on the angle under which the scattering occurs.
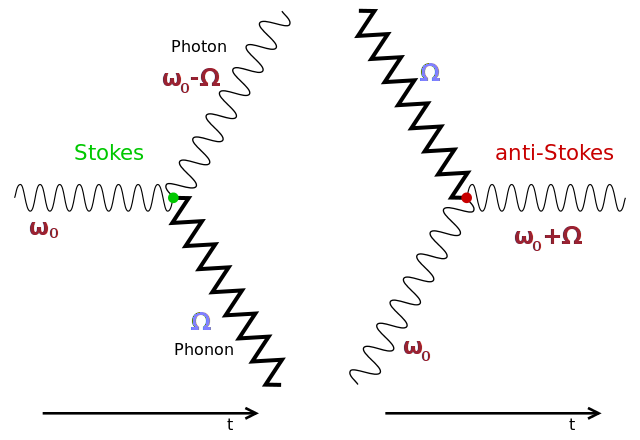
The most important and most common technique for determining dispersion relations is Raman scattering, a.k.a. Raman spectroscopy (the two names emphasise the momentum and the energy transfer aspect, respectively). Raman scattering uses electromagnetic radiation, typically infrared light, and the processes involved in Raman scattering can be explained using Feynman diagrams (Fig.). A Stokes process involves phonon creation, i.e. an incident photon transfers energy to the crystal lattice, causing a lattice vibration (a phonon). As a result, the energy of the photon is reduced. The higher the frequency of the phonon, the more energy is transferred and the more the frequency of the photon is reduced. Since momentum as well as energy is conserved, the phonon and photon travel in different directions from the scattering site. An anti-Stokes process is the whole sequence in reverse, i.e. phonon absorption, whereby a phonon scatters with an incident photon and transfers its energy and momentum to the photon. Therefore the frequency of the scattered photon will be higher than that of the incident radiation. In both cases, the frequency difference, $\Omega$, between incident and scattered light corresponds to the phonon frequency of the vibration probed by the interaction. By measuring the frequencies of spectral lines as a function of scattering angle, dispersion curves can be mapped out.
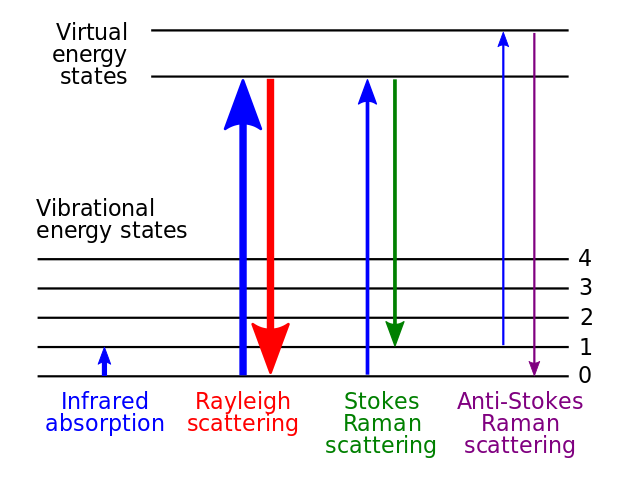
The Fig. summarises in terms of vibrational energy levels the different interactions taking place when a beam of photons interacts with a solid. In a pure absorption process, an incident photon is absorbed and its energy used to lift a phonon mode into an excited vibration state. The infrared spectrum sees an absorption line, i.e. a reduction in transmitted intensity at the frequency corresponding to this transition. In Rayleigh scattering a photon is absorbed and immediately released again. This release can occur in arbitrary directions, so the intensity of scattered light is independent of the angle at which it is measured. Since the energy of the incident and scattered photon are the same, there is no net energy change, i.e. Rayleigh scattering is an elastic scattering process. Neither of these processes tells us anything about the dispersion relation of the sample. This is where the two Raman scattering processes come in: In Stokes transitions, a phonon mode is excited into an excited vibration state and then released again into a different, still excited state. Therefore, the scattered photon has a lower energy than the incident photon. In anti-Stokes transitions, a phonon in an excited state is excited into an even higher vibrational state by absorbing a photon from the source and immediately releases another photon by dropping into the vibrational ground state. Therefore, the scattered photon has a higher energy than the incident one.
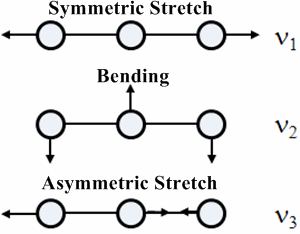
Not all phonon modes in solids are Raman-active modes, i.e. Raman scattering can only determine parts of the dispersion relation of a solid. The reason is that Raman modes are subject to a selection rule: A mode is only Raman-active if the polarizability, $\alpha$, of the local environment changes during the vibration. The polarisability determines the strength of the electrical dipole moment, $p$, induced by an external electrical field: $p=\alpha E$. For example, in a linear configuration of three atoms (whether in a molecule or a crystal lattice), the symmetric stretch mode is Raman active, while the asymmetric stretch and bending modes aren't as they don't affect the polarisability. The Raman selection rule is opposite to the selection rule for infra-red spectroscopy, which requires that the dipole moment changes during an IR-active vibration. Modes can therefore be either IR-active or Raman-active but not both.
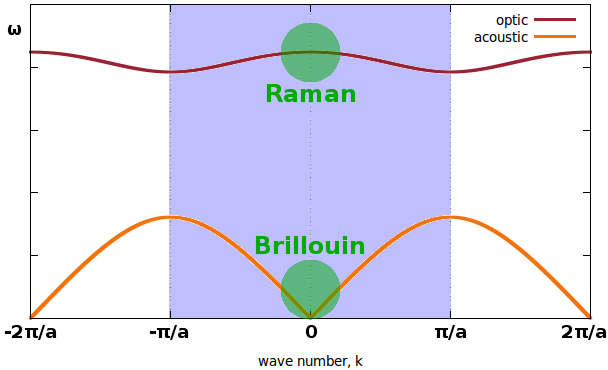
From the above it is clear that Raman scattering is very versatile but that it can only determine part of the dispersion relation of any solid. The main advantage of the technique is that it is relatively easy and inexpensive to set up and therefore is the routine method of choice to get an insight into the vibrational properties of solids. In the main, Raman characterises optical phonons, given that it probes relatively large frequencies, $\nu$, from 300GHz to 300THz. The wave vector range that corresponds to the energies of infrared photons also limits the technique to phonons close to the centre of the Brillouin zone, $k\approx 0$.
Raman scattering measures optical phonons because the relatively large energy transfers mean that the high frequencies characteristic of optical phonons are excited. However, acoustic phonons can also be excited using electromagnetic radiation. The corresponding technique is called Brillouin scattering, and it is based on the same processes as Raman scattering and is subject to the same selection rule. In order to probe acoustic phonons, much smaller energy transfers need to be measured, and therefore the frequency resolution must be much higher. While Raman scattering can be done using an optical grating to resolve the spectrum, a Fabry-Perot interferometer is typically used in Brillouin spectrometers, i.e. the incident beam is reflected back and forth between two semi-transparent mirrors and made to interfere with itself. Interference is constructive only if the distance between the mirrors is an integer multiple of the wavelength, effectively monochromatising the beam. The spectrum is swept by changing the mirror spacing. This provides the necessary resolution to measure frequencies, $\nu$, up to 200GHz, characteristic of acoustic phonons. Like Raman scattering, Brillouin scattering is limited to wave vectors close to the centre of the Brillouin zone, $k\approx 0$.
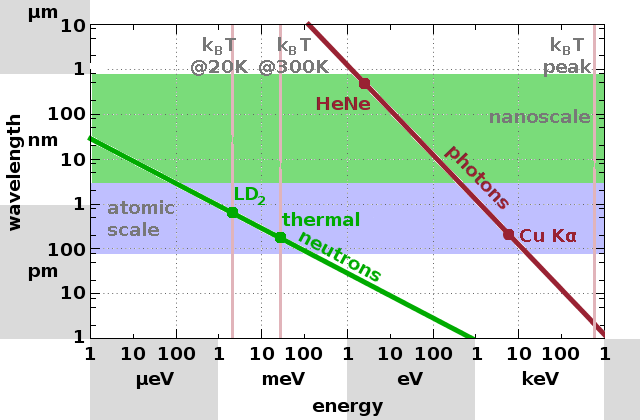
Thermal neutrons can be used instead of photons to probe phonons in solids. Because neutrons are quantum particles, they have a de Broglie wavelength which can be adjusted via the energy of the particles. This is achieved by thermalising neutrons from a source such as a nuclear reactor in a medium kept at a constant temperature. For thermal neutrons, both energy and wavenumber are matched to phonons in a solid, which means that the whole Brillouin zone is accessible, not just the wave vector range close to the centre of the Brillouin zone. Furthermore, there is no selection rule for inelastic neutron scattering since neutrons interact with the nuclei of the atoms in the sample rather than the electron clouds. This makes inelastic neutron scattering a particularly powerful technique which can map the entire dispersion relation even of complex solids. However, the fact that experiments have to be conducted at a research facility, the low flux of neutron sources compared with that available with lasers, and the complex time-of-flight detectors needed to capture the spectral information prevents the technique from becoming a routine tool for the study of vibrational dynamics.
Following coverage of the atomic and electronic structure of solids and their lattice dynamics, we will now turn to the magnetic structure and properties of solids.
.svg)