
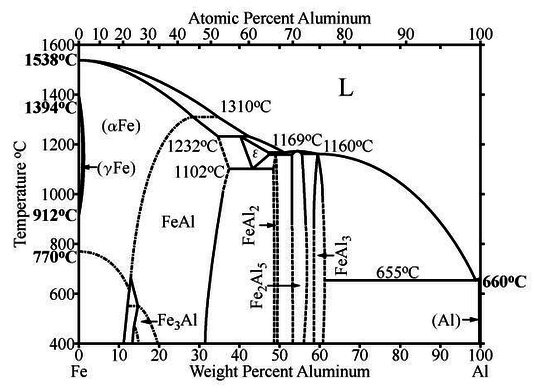
This case study is taken from a recent research paper on the effect of severe platic deformation on the structure of alloys. It demonstrates how order parameters are selected for a particular phase transition and how they can then be measured using a quantitative experimental observable. Before we can appreciate the phase transitions in this system, we have to have a look at the phase diagram of the binary system Fe-Al and see what phases exist and what their structures are. This particular study is concerned with the alloy $\mathrm{Fe_3Al}$.
The T(x) phase diagram shows a liquid phase and several stoichiometric solid phases with specific compositions. Their single-phase regions have a finite width around the nominal composition because some excess iron or aluminium can be dissolved in the otherwise stoichiometric phase. Between these phases, there are miscibility gaps, where the sample presents as a mixture of two dispersed phases with distinct composition.
Each particular compound, such as $\mathrm{Fe_3Al}$, has its own crystal structure with precisely defined atom positions within the unit cell, and we can distinguish ordered alloys from disordered ones depending on whether the chemical species occupying each atom position is defined or arbitrary. The disorder referred to here is chemical disorder, not positional disorder - even in a disordered alloy, we know exactly where the atoms are located, we just don't know which element occurs at a particular lattice point.
If iron and aluminium occur in equal parts (FeAl), the resulting crystal structure is the CsCl structure type, i.e. the Fe atoms are in the corners of the cubic unit cell, and the Al atoms are in a body-centred position. Since the eight corners are shared amongst eight adjacent unit cells, this results in a 1:1 stoichiometry. The two species are interchangeable since the co-ordination environments of both species are the same - a cube whose corners is made up by the other species, respectively.

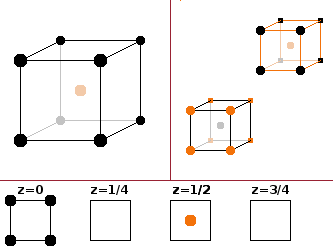
In order to adapt this structure to accommodate three times as many iron atoms ($\mathrm{Fe_3Al}$), it is necessary to look at a cluster of 8 unit cells where every other centre atom is replaced by the same atom type that occupies the corners. Of course that means that the original eight unit cells in the cluster are no longer identical. The whole cluster of eight becomes the new unit cell, which now contains the following atoms:
Another way to look at this is to divide the structure into 4 equivalent, overlapping sublattices, each of which having fcc type (when ignoring the atoms belonging to the three other sublattices). Three of these sublattices are occupied by iron atoms and one by aluminium. The fact that they are equivalent can be seen by verifying that they have identical co-ordination environments, in this case tetrahedra.
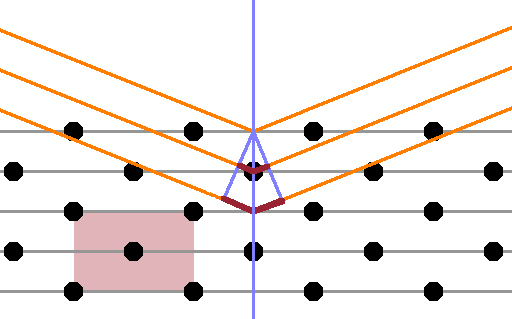
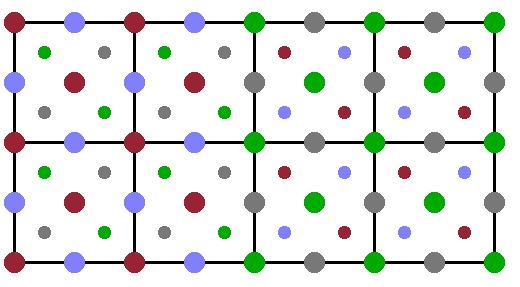
In the cubic structure, the periodicity is the same along each of the three lattice vector, so it is sufficient to look at a projection along one lattice vector and dispense with the perspective for clarity. The Fig. shows such a perspective, with the atoms in the front plane shown at full size, and the ones in the centres of the octants (at y=¼) a little smaller. The four equivalent, overlapping sublattices are evident in this view, each consisting of the front face of an fcc cell of atoms of the same colour (while ignoring the atoms of all the other colours). When drawn on top of one another, the overlapping nature of the sublattices becomes obvious: the origin of each sublattice is displaced from its neighbours by a quarter of the space diagonal of the unit cell.
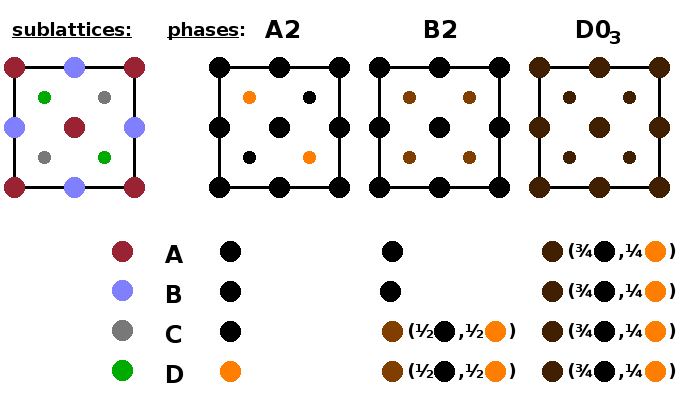
Now the geometry of the $\mathrm{Fe_3Al}$ structure is established, we can distinguish three different phases according to the degree of their chemical ordering. The ordered phase, A2, has three of the sublattices occupied by iron atoms and the remaining one by aluminium, as described above. In the partially ordered phase, B2, two of the sublattices remain occupied by iron, while the other two sublattices have an even mixture of iron and aluminium. Finally, in the disordered phase, $\mathrm{D0_3}$, all four sublattices are occupied randomly by both elements in a 3:1 ratio. It is important to note that there is no positional disorder in any of these phases, i.e. each of these phases is a perfect crystal with precise atom positions. The only difference is the extent to which the location of the aluminium atoms is randomised. As there are three different phases, there will be two phase transitions between them.
| phase | $c_A$ | $c_B$ | $c_C$ | $c_D$ | $Q_1$ | $Q_2$ | ||
|---|---|---|---|---|---|---|---|---|
| ordered (A2) | 1 | 1 | 1 | 0 | 1 | 1 | ||
| part. ordered (B2) | 1 | 1 | ½ | ½ | 1 | 0 | ||
| disordered ($\mathrm{D0_3}$) | ¾ | ¾ | ¾ | ¾ | 0 | 0 |
In order to describe the approach to either of these transitions, we need to define an order parameter. It needs to be derived from an experimentally accessible quantity which is significantly different in both phases either side of the transition, and it must be zero in the disordered phase and approaching one in the limit of very low temperature in the ordered phase. In this case, we can define order parameters based on site occupancy for both transitions. Taking $c_i$ as the fraction of iron atoms in sublattice $i$ (the remainder being aluminium atoms), the order parameters $$Q_1=c_A-c_C+c_B-c_D\quad\textrm{and}\quad Q_2=c_C-c_D$$ fulfil the mathematical conditions for the transition between the partially ordered and disordered phase, and between the ordered and the partially ordered phase, respectively.
Site occupancies cannot be measured directly, but they can be derived by x-ray diffraction, specifically by analysing the appearance or disappearance of peaks as the symmetry of the crystal changes at the phase transition. When introducing diffraction, we have seen how systematic absences can occur when a primitive cell is replaced by a centred cell (Fig.). The centred atoms effectively constitute an additional lattice plane parallel to the ones corresponding to the unit cell boundaries, causing destructive interference between rays reflected at the unit cell boundaries and the plane containing the centred atoms. As a result, a Bragg peak that would be present in a primitive cell is absent in its centred counterpart.
The opposite of this effect are superstructure reflections, i.e. reflections related to a periodicity over a period which is longer than the underlying unit cell. This is the case in the $\mathrm{Fe_3Al}$ alloy. The ordered phase has a unit cell which is eight times as large as the unit cell of the disordered phase (twice as large in each crystallographic orientation), so additional reflections will arise when the ordering occurs.
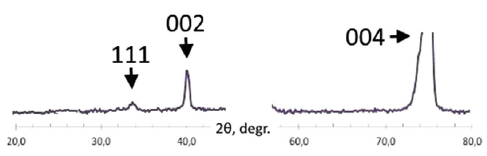
The Fig. shows the diffraction pattern reported by the authors of the case study of the ordered phase of $\mathrm{Fe_3Al}$. In addition to the (004) standard reflection of the averaged $\mathrm{Fe_3Al}$ cell, there are also weaker reflections according to the superstructure. There is a (002) superstructure reflection relating to $Q_1$ order parameter and reflecting the fact that the octant-centre positions become distinguishable from the corner positions. In addition, there is also a (111) superstructure reflection relating to $Q_2$ order parameter, which arises from the breaking of the symmetry along the spatial diagonal of the unit cell at that transition.
Having established an order parameter for a transition, it is necessary to monitor the underlying experimental quantity (in this case, the intensity of the superstructure peaks in XRD) while driving the phase transition by changing a thermodynamic state variable such as temperature or pressure. In the case study, the phase transition is triggered by changing pressure.
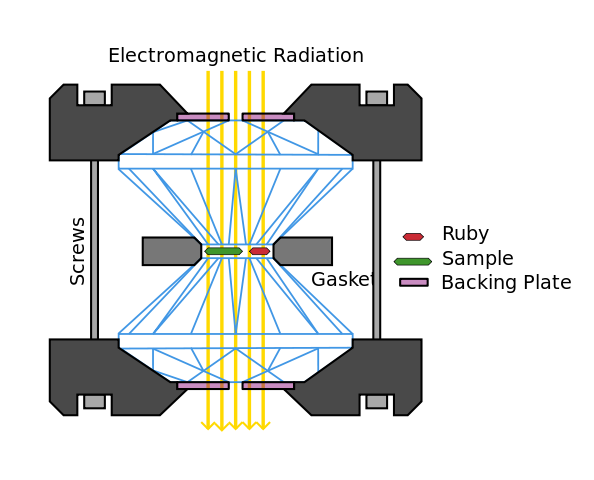
In-situ pressure-dependent x-ray experiments typically use a diamond anvil cell, which allows x-rays to pass through the pressurised medium. Here the sample is placed between two faceted diamond single crystals surrounded by a gasket, which are clamped into a frame. Pressure is applied by tightening screws in the frame which push the diamonds against one another. Diamond is used for this purpose because of its hardness and resilience but also because it is largely transparent to high-energy x-rays owing to its low atomic number. A piece of ruby is usually compressed alongside the sample to provide internal pressure calibration - ruby doesn't have any phase transitions in the pressure range covered and its compressibility is well known so that pressure values can be determined from the positions of its Bragg peaks. The authors of the case study used an older cell design known as a Bridgman anvil cell.
When working out site occupancies from the intensities of diffraction peaks, it is important to compare the integral intensity of the peaks, i.e. the area under the curve. as this represents all the photons scattered by that particular lattice plane. Using the amplitude of the peak instead would be misleading, particularly if the peak width changes during the experiment.
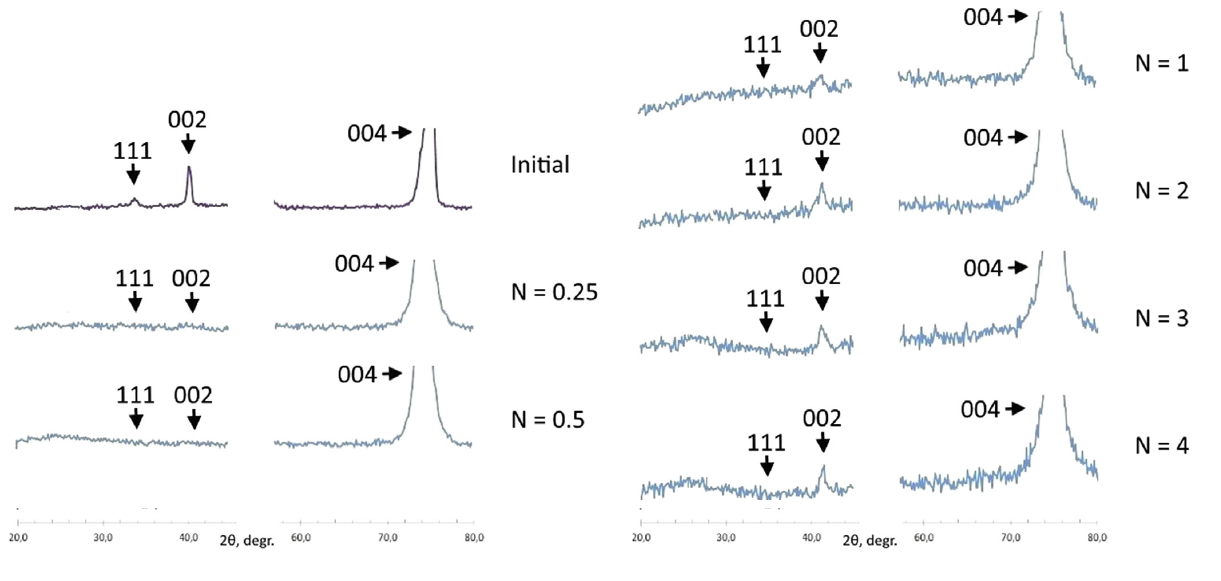
The Fig. shows the evolution of the diffraction pattern as the pressure increases. The number, $N$, of turns of the screws on the cell frame can be taken as proportional to the pressure applied. Both superstructure peaks disappear as soon as pressure is applied. The (002) superstructure peak associated with order parameter $Q_1$ returns if the pressure is further increased. This suggests that the sample, which originally is in the ordered phase, transforms into the disordered phase as soon as some pressure is applied. It then transforms again into the partially ordered phase as the pressure rises further.
When severe plastic deformation, SPD, is inflicted on an ordered alloy, the material typically responds by generating anti-phase boundaries, i.e. lines along which the sublattices are shifted with respect to one another. In the Fig., the right hand side of the crystal is shifted by a quarter of the spatial diagonal of the cubic unit cell, so that the D-sublattice takes up the lattice points of the A-sublattice. Such anti-phase boundaries are akin to dislocations in the case of positional disorder, except that in this case the atom positions remain unchanged but the speciation of the lattice sites with the different elements of the alloy is varied systematically.
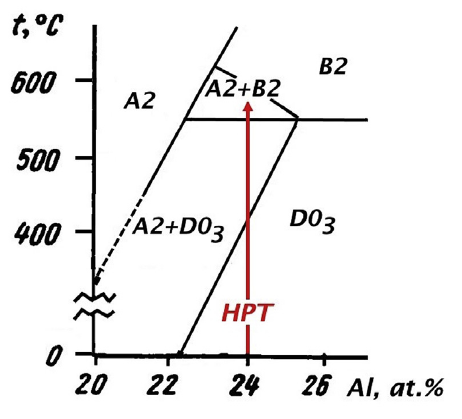
If this happens in many places at once, the sequence of the sublattices can be severely disrupted, and the long-range order lost as a consequence. This explains the transition from the ordered phase (A2) to the disordered phase ($\mathrm{D0_3}$) when pressure is applied first. As the phase diagram shows, the partially ordered B2 phase should only exist above $\mathrm{550^oC}$. However, phase diagrams generally only describe the situation in thermal equilibrium, and the conditions under severe plastic deformation are quite severe. Therefore it is likely that the sample follows a non-equilibrium pathway to reach a high-temperature phase, which is then subsequently frozen in as a metastable configuration. An alternative explanation could be that the energy supplied by the sudden pressure increase could heat the sample above the (equilibrium) transition temperature, again freezing the high-temperature phase on cooling.
This concludes the notes on (my part) of our Condensed Matter modules. In these lecture courses, we have covered structural, electronic, magnetic and vibrational properties of solids, described crystal structures based on symmetry, looked at their imperfections and the resulting properties of materials, investigated a number of experimental approaches to understanding the structure of materials including microscopy, scattering and spectroscopic techniques. We have also discussed a number of specific material classes such as glasses, polymers, semi- and super-conductors and studied the phase transitions occurring between different forms of a material.