

An open system allows the inflow of particles with associated energy. This means that the change of the internal energy of an open system has additional terms beyond the usual entropy and volume terms. There is one term for each type, $i$, of particle (distinct chemical species): $${\rm d}U=T{\rm d}S-p{\rm d}V+\sum_i\mu_i{\rm d}N_i\qquad.$$ The additional terms are proportional to the change in the number of those particles, ${\rm d}N_i$, and the energy contributed per added particle. The latter is called the chemical potential, $\mu_i$, of that species. Therefore, we can determine the chemical potential of a particular species, $k$, by measuring the change of the energy of the system when adding or removing particles of species $k$ while keeping the entropy, the volume and the amounts of all the other species constant: $$\mu_k=\left.\frac{\partial U}{\partial N_k}\right|_{S,V,N_{i\neq k}}\qquad.$$
Instead of starting with the differential internal energy, we can start with the differential free enthalpy (or, in fact, any of the other energy functions): $${\rm d}G=V{\rm d}p-S{\rm d}T+\sum_i\mu_i{\rm d}N_i\qquad.$$ In that case, pressure, temperature and the amounts of all other species need to be kept constant in order to reveal the chemical potential of species $k$: $$\mu_k=\left.\frac{\partial G}{\partial N_k}\right|_{p,T,N_{i\neq k}}\qquad.$$
While this differential relationship between the chemical potential and the Gibbs enthalpy under these specific conditions is valid, a more general relationship can be found between these two properties. To show this, start again at the differential internal energy: $${\rm d}U=T{\rm d}S-p{\rm d}V+\sum_i\mu_i{\rm d}N_i\qquad,$$ then consider a marginally increased system, in which all extensive state variables increase by a factor $\alpha(\ll 1)$ small enough to ensure all increases are linear. Then $$U_1=(1+\alpha)U_0\quad\Leftrightarrow\quad {\rm d}U=\alpha U$$ and, similarly, $${\rm d}S=\alpha S,\qquad {\rm d}V=\alpha V\qquad\textrm{and}\qquad {\rm d}N_i=\alpha N_i\qquad.$$ Substituting these relationships into the differential internal energy equation produces $$\color{red}{\cancel{\color{black}{\alpha}}} U=\color{red}{\cancel{\color{black}{\alpha}}} TS-\color{red}{\cancel{\color{black}{\alpha}}} pV+\sum_i\color{red}{\cancel{\color{black}{\alpha}}}\mu_iN_i\qquad,$$ where $\alpha$ cancels out. The differential internal energy equation is the only one of the four differential energies for which this works because it is the only one that comprises exclusively extensive variables - for the others there would be at least one term (${\rm d}p$ or ${\rm d}T$) that doesn't scale with the amount of material and therefore $\alpha$ wouldn't cancel. Since $$G=H-TS=U+pV-TS\qquad,$$ the first three terms can be replaced by the Gibbs enthalpy: $$G=\sum_i\mu_iN_i\qquad.$$ Therefore, the chemical potential represents the Gibbs enthalpy per particle, under any conditions, not just when $p$ and $T$ are kept constant. The condition for a mixture to be in thermodynamic equilibrium is therefore that temperature, pressure and the chemical potential of all components are constant: $$T,p,\mu_i=\textrm{const.}\qquad.$$
Gibb's phase rule was introduced in the context of phase equilibria in single-component systems, where it determines how many thermodynamic variables can be changed independently without changing between solid, liquid and gas. It is even more useful in multi-component systems, i.e. mixtures. The phase rule links the number of degrees of freedom (number of variables that can be changed independently) with the number of components (chemically distinct species) and phases (parts of the sample which have either different composition or state of matter, or both): $$F=C-P+2\qquad.$$ The variables which describe a multi-component system are the pressure, the temperature, and the molar fractions of each component in each phase, considering that the molar fractions in each phase have to add up to 1: $$\sum_{i=1}^Cx_i=1\qquad.$$ Therefore, we have for the total number of variables: $2+P(C-1)$. The condition of phase equilibrium demands that the chemical potential of each component must be the same in each phase: $$\mu_1=\mu_2=\dots=\mu_P\quad\textrm{for each component}\qquad,$$ and this determines the molar fractions in each phase. Therefore, we find the number of restrictions: $C(P-1)$ if the system is in equilibrium. The number of degrees of freedom, i.e. the number of variables that can be adjusted independently is the difference between the total number of variables and the restrictions in place: $$F=[2+P(C-1)]-[C(P-1)]=C-P+2\qquad.$$ If $F$ or fewer variables are changed in a process, the system can respond by adjusting other variables without new phases being formed or existing phases disappearing. If more than $F$ variables change at once, the number of phases co-existing in the system will change as a result.
Phase diagrams show how different state variables are linked while a system is in equilibrium. The assumption is that all other state variables remain constant. Examples we have used so far are the $p(V)$ diagrams often used to illustrate the (isothermal) behaviour of gases and the $p(T)$ diagrams showing the phase transition lines and the triple point in a single-component system. In binary mixtures ($C=2$), the molar fraction, $x_1$, of one component is another state variable. The molar fraction of the other component, $x_2$, is then determined by the fact that the two molar fractions have to add up to 1: $$\sum_ix_i=1\qquad.$$ This leads to another type of phase diagram, the T(x) diagram, which links temperature and composition and shows the compositions of the various phases in a mixture. For example, milk and butter are both mixtures of the same two components (fat and water) but their molar fractions are reversed. As a consequence, the two mixtures have different melting temperatures.
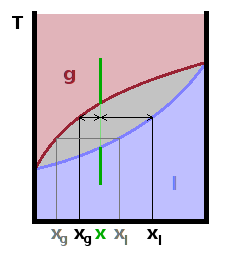
Consider a system where the two components mix well both in the gas phase and in the liquid phase. Since the two pure components on their own will have different boiling points, one might expect the mixture to boil at an intermediate temperature between the two boiling points. In fact, the lower-boiling component will begin to boil a little earlier than the other component, leading to the formation of a gas phase enriched in the more volatile component, leaving the remaining liquid enriched in the less volatile component. Therefore, there is a region in the phase diagram, where the two phases with different composition are in equilibrium. As we increase the temperature of a mixture of a given composition $x$ (green line in the Fig.), it splits into two phases with different compositions. The compositions of the two phases for a given temperature can be read off the $T(x)$ diagram, and their relative amounts can be determined by the law of the lever, i.e. the relative distance of the phase boundary lines from the nominal composition of the mixture.
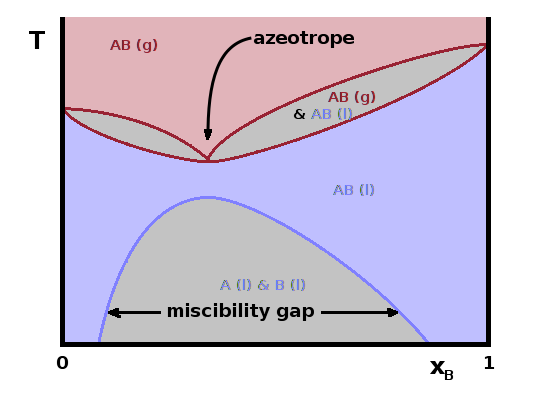
The phase diagram shown above applies if the two forms mix well both in the liquid and the gaseous state. However, sometimes there is a miscibility gap in the liquid state. For example, no matter how vigorously you mix oil and water, it will phase separate at room temperature because the two types of molecule repel each other. However, it is possible to dissolve a small amount of water in oil or the other way around. There is a miscibility gap (two-phase region) in the middle of the compositional range while there are single-phase regions for $x\to 0$ or $x\to 1$. At higher temperature, such a miscibility gap often narrows or disappears entirely if the thermal energy is large enough to overcome the potential energy that forces the molecules to separate. The relative composition of the two phases and their amounts can again be found using the law of the lever.
Sometimes, there is a particular composition at which the whole mixture boils as one, without phase separation. This can either be a minimum or a maximum of the boiling point of the system along the compositional co-ordinate and is known as an azeotrope. This is caused by intermolecular forces between the two components being at a minimum or at a maximum at this particular composition, e.g. if regular clusters of molecules can are formed if the two components are mixed in this particular ratio. In such cases, the $T(x)$ diagram essentially splits in two sections, with two-phase regions extending from the azeotrope towards the boiling points of either pure phase.
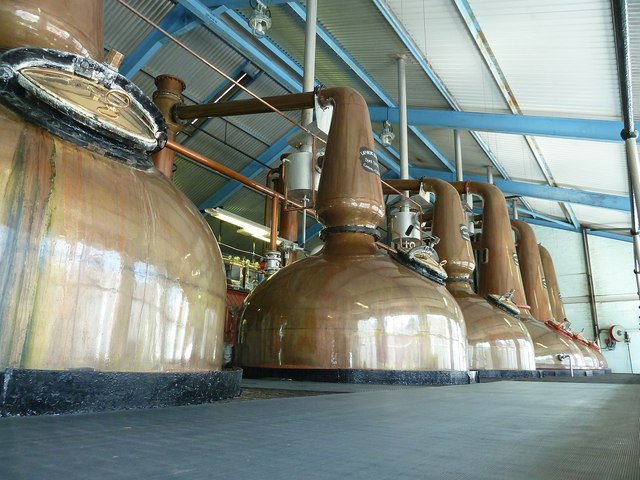
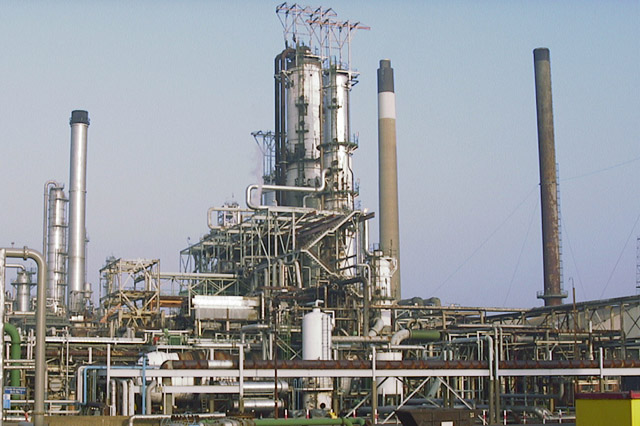
The technical process of distillation utilises the tendency of mixtures to separate into a gas phase enriched in the volatile component and a liquid phase enriched in the less volatile component. A liquid is boiled while the vapour is condensed into a separate vessel. By adjusting the temperature, the composition of the distillate can be controlled. Choosing a higher distillation temperature speeds up the process and increases the yield but at the expense of purity. If the mixture has an azeotrope with a boiling point minimum, the distillate will have the composition of that azeotrope. This is the reason why the strength of distilled spirits is limited to about 95% ethanol - this is the composition of the ethanol/water azeotrope.
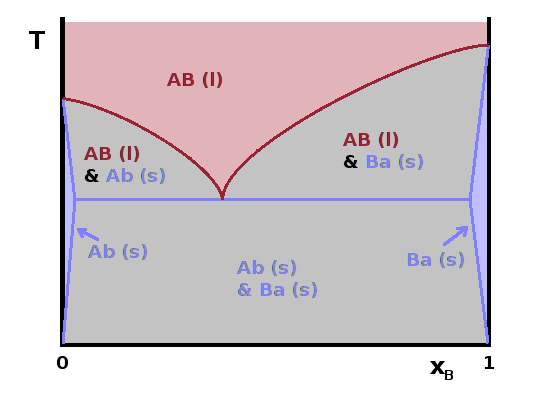
$T(x)$ phase diagrams around the melting transition follow similar principles to the boiling diagrams introduced above. However, given that solids tend to form crystal structures, which require the components to occur stoichiometrically, i.e. in simple composition ratios determined by the crystal structure, miscibility gaps in the solid phase are typically much wider and extend all the way up to the melting line. Of course there may be a miscibility gap in the liquid phase, too. The crystal structure of each component can usually accommodate a small amount of the other component as an impurity without disrupting the overall crystal structure. This causes very narrow single-phase regions or solid solutions near $x\to 0$ and $x\to 1$. In between lies a two-phase region of the two crystals with their respective small impurity concentrations.
The equivalent of an azeotrope on the liquid-solid boundary is a eutectic. These are always minima of the melting point and are much more common than azeotropes. They always lie between particular compositions for which a distinct crystal structure exists. At lower or higher compositions, the melting point is higher, and phase separation occurs between a melt of eutectic composition and a solid corresponding to the end point of the composition scale (perhaps with a little impurity). The line that separates the melt from the two-phase regimes (purple) is called the liquidus, and the boundary between the solid single-phase regions and the two-phase regions (blue) is the solidus.
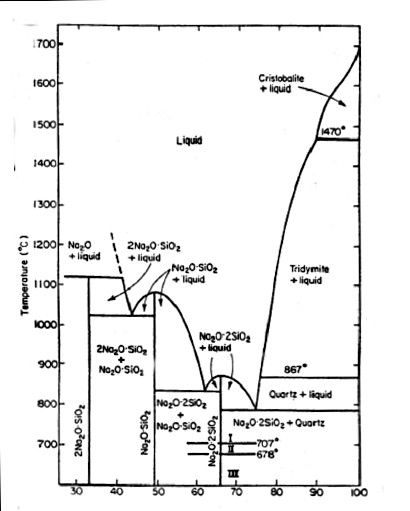
The Fig. shows the phase diagram of the system $\mathrm{Na_2O-SiO_2}$, where the silica fraction increases towards pure $\mathrm{SiO_2}$ on the right. There are several intermediate compounds associated with eutectics. Each of these corresponds to a specific stoichiometry and crystal structure, with a $\mathrm{Na_2O : SiO_2}$ ratio of 2:1, 1:1 or 1:2, respectively. As can be seen, the melting point changes by 900K depending on the composition, an important fact in glass making! This is the reason why the glass industry has embraced recycling: it takes a lot less energy to dissolve quartz sand in a disilicate melt than to melt pure quartz. The horizontal lines on the right separate the different polymorphs (distinct crystal structures) of $\mathrm{SiO_2}$ thermodynamically stable at different temperatures.
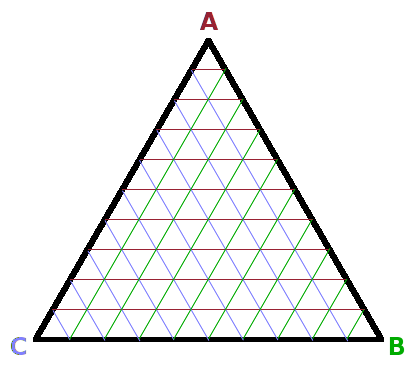
In ternary systems $(C=3)$, two components can vary independently, while the third is then fixed because the molar fractions of all components have to add up to 1: $$x_1+x_2+x_3=1\qquad.$$ Phase diagrams for ternary compounds are therefore often plotted as triangles, where the molar fraction of each component rises from 0 along one of the bases of the triangle towards 1 in the opposite corner. Each point in the triangle therefore corresponds to a particular composition.
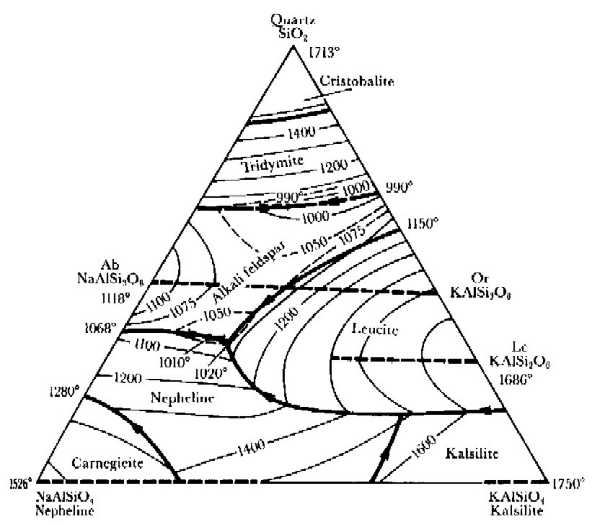
Melting points of the mixtures can be plotted inside the triangle, and points of the same melting temperature can be connected to reveal lines along which the composition can be changed without changing the liquidus. The Fig. shows an example of this with relevance in geology, the system quartz-nepheline-kalsilite. The bold lines show the location of local maxima of the liquidus, and the arrows on them indicate how the composition of the melt changes as it is approaching a eutectic upon cooling under conditions of thermodynamic equilibrium.
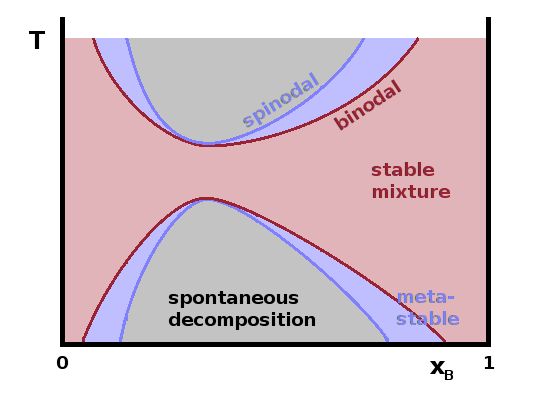
Most phase diagrams are limited to equilibrium conditions. However, it is possible to include metastable phases in simple binary $T(x)$ diagrams. In this context, the normal equilibrium phase transition line is known as the binodal as it separates a single-phase region from a two-phase region. It is possible for the single phase to persist beyond this line as a metastable phase without suffering phase separation if there aren't any nucleation sites where the phase transition can begin. However, the limit of the metastable region is given by the spinodal, beyond which spontaneous decomposition will occur. This behaviour is similar to the phenomena of oversaturation and retarded boiling we have seen in metastable real gases of a single component, except that the composition of the mixture is varied here instead of pressure. Such metastable behaviour is a feature of first-order phase transitions and arises from the balance of the free enthalpy of the two phases on either side of the transition as described by Landau theory, which will be discussed in more detail in the Materials Physics lecture in Y3.
Up to now, we have been concerned with macroscopic systems without giving much consideration to their internal make-up. State variables have been calculated from macroscopic observations using theoretical relationships. Statistical thermodynamics arrives at the same point by calculating state variables from the properties of atoms using statistical means.